Geospatial data visualization for Spatial Analytics aims to use Yelp data to examine how people's affect is spatially distributed across the neighborhood - MetroTech Center in New York City.
Three main areas where people are most likely to be happy are:
- Jay Street–MetroTech Station area
- City Point
- MetroTech Center Plaza
- StackPython, ArchGIS, QGIS
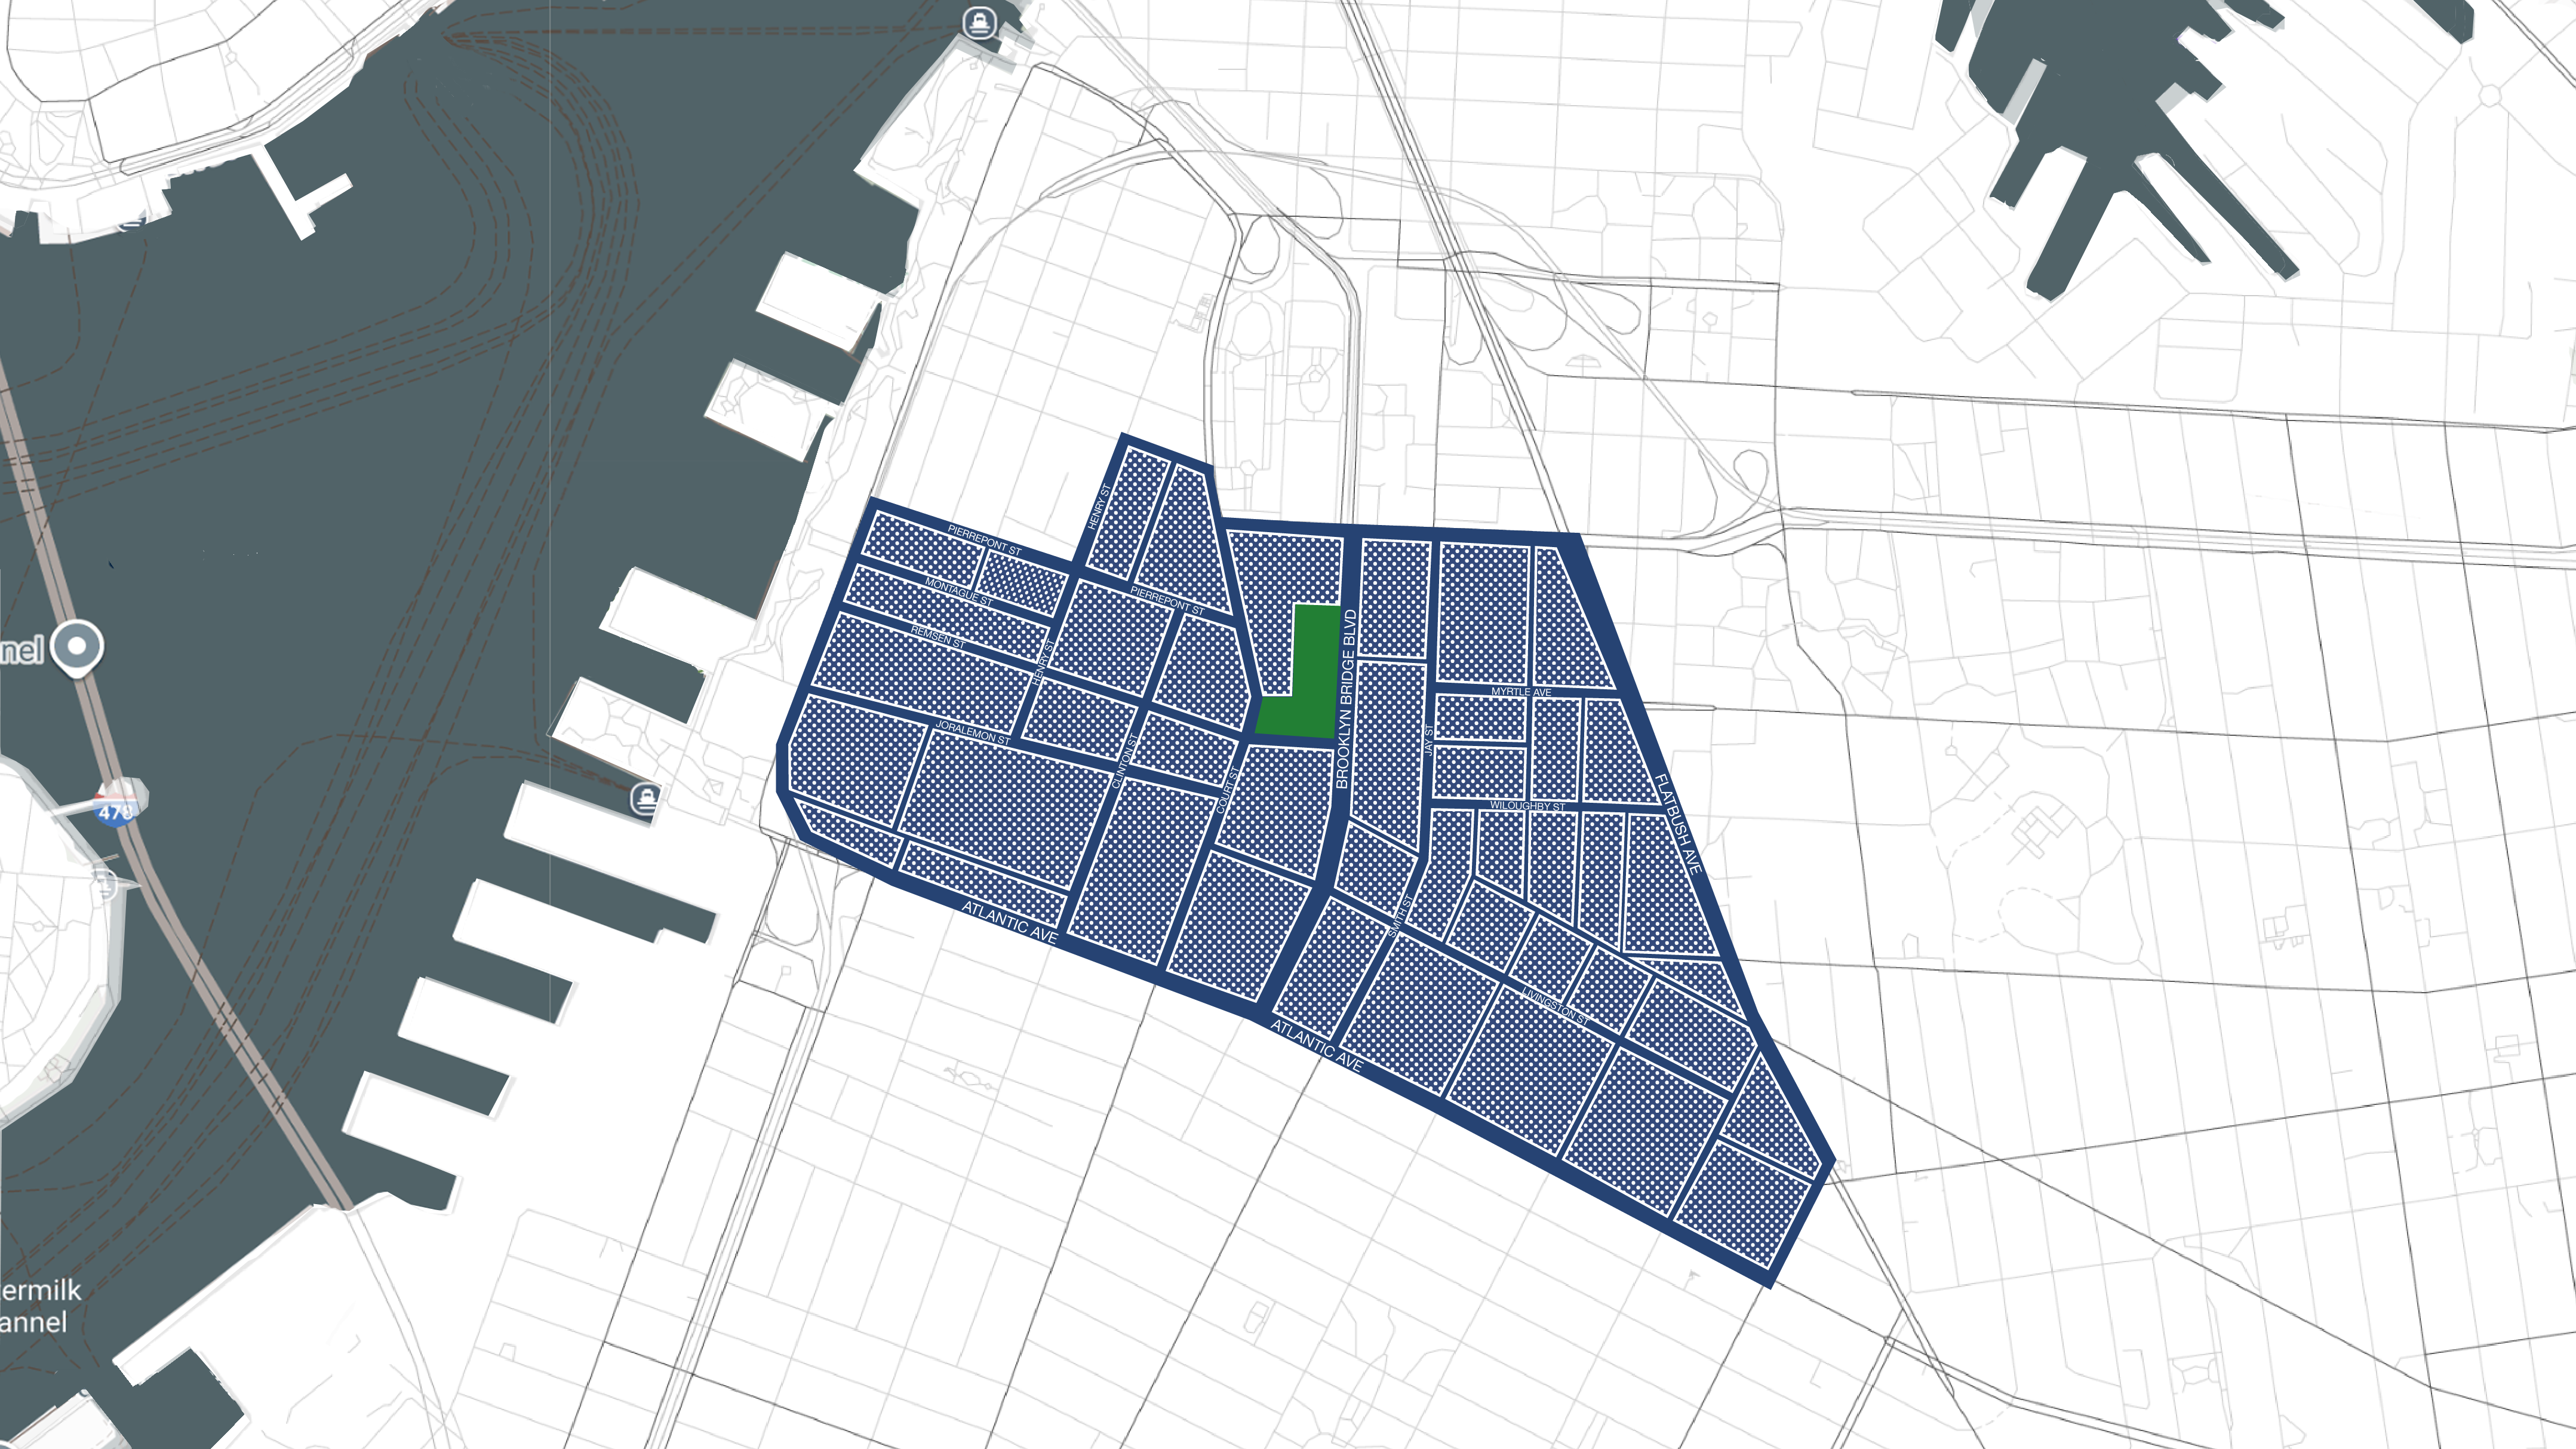
Figure 1: area of MetroTech Center
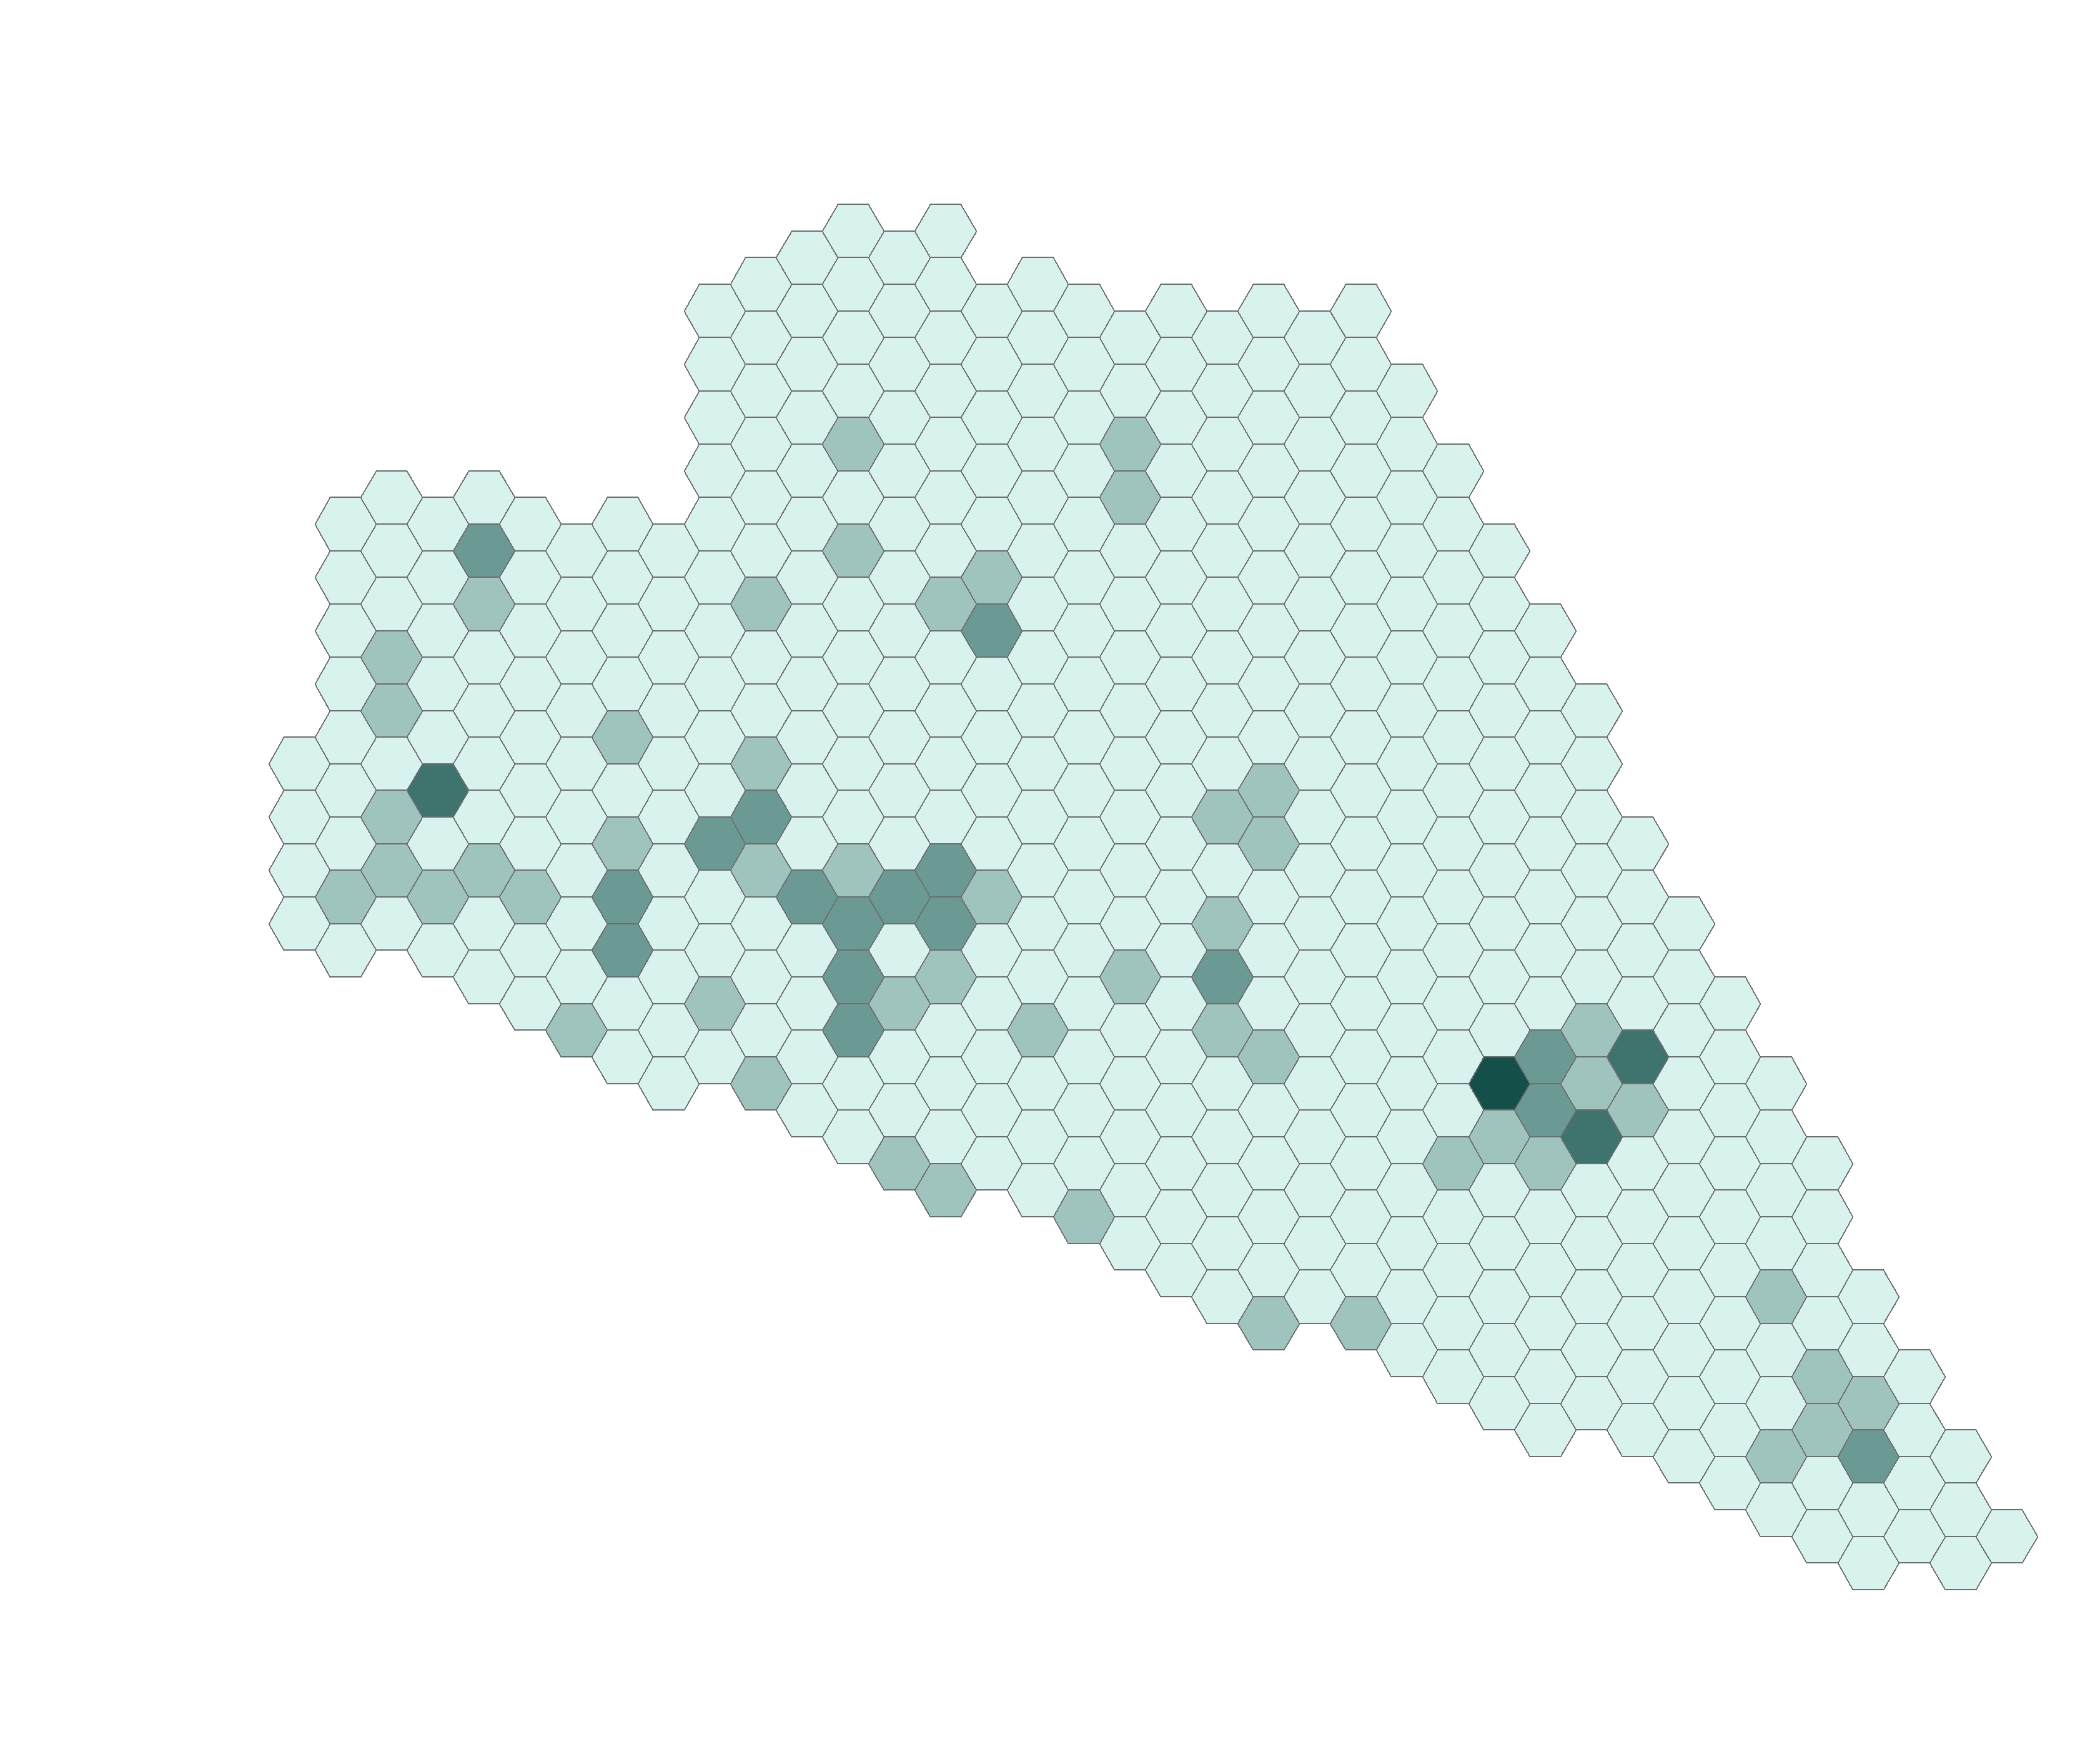
Figure 2: restaurants density in the area of MetroTech Center (spatial joint with hexagon grid)
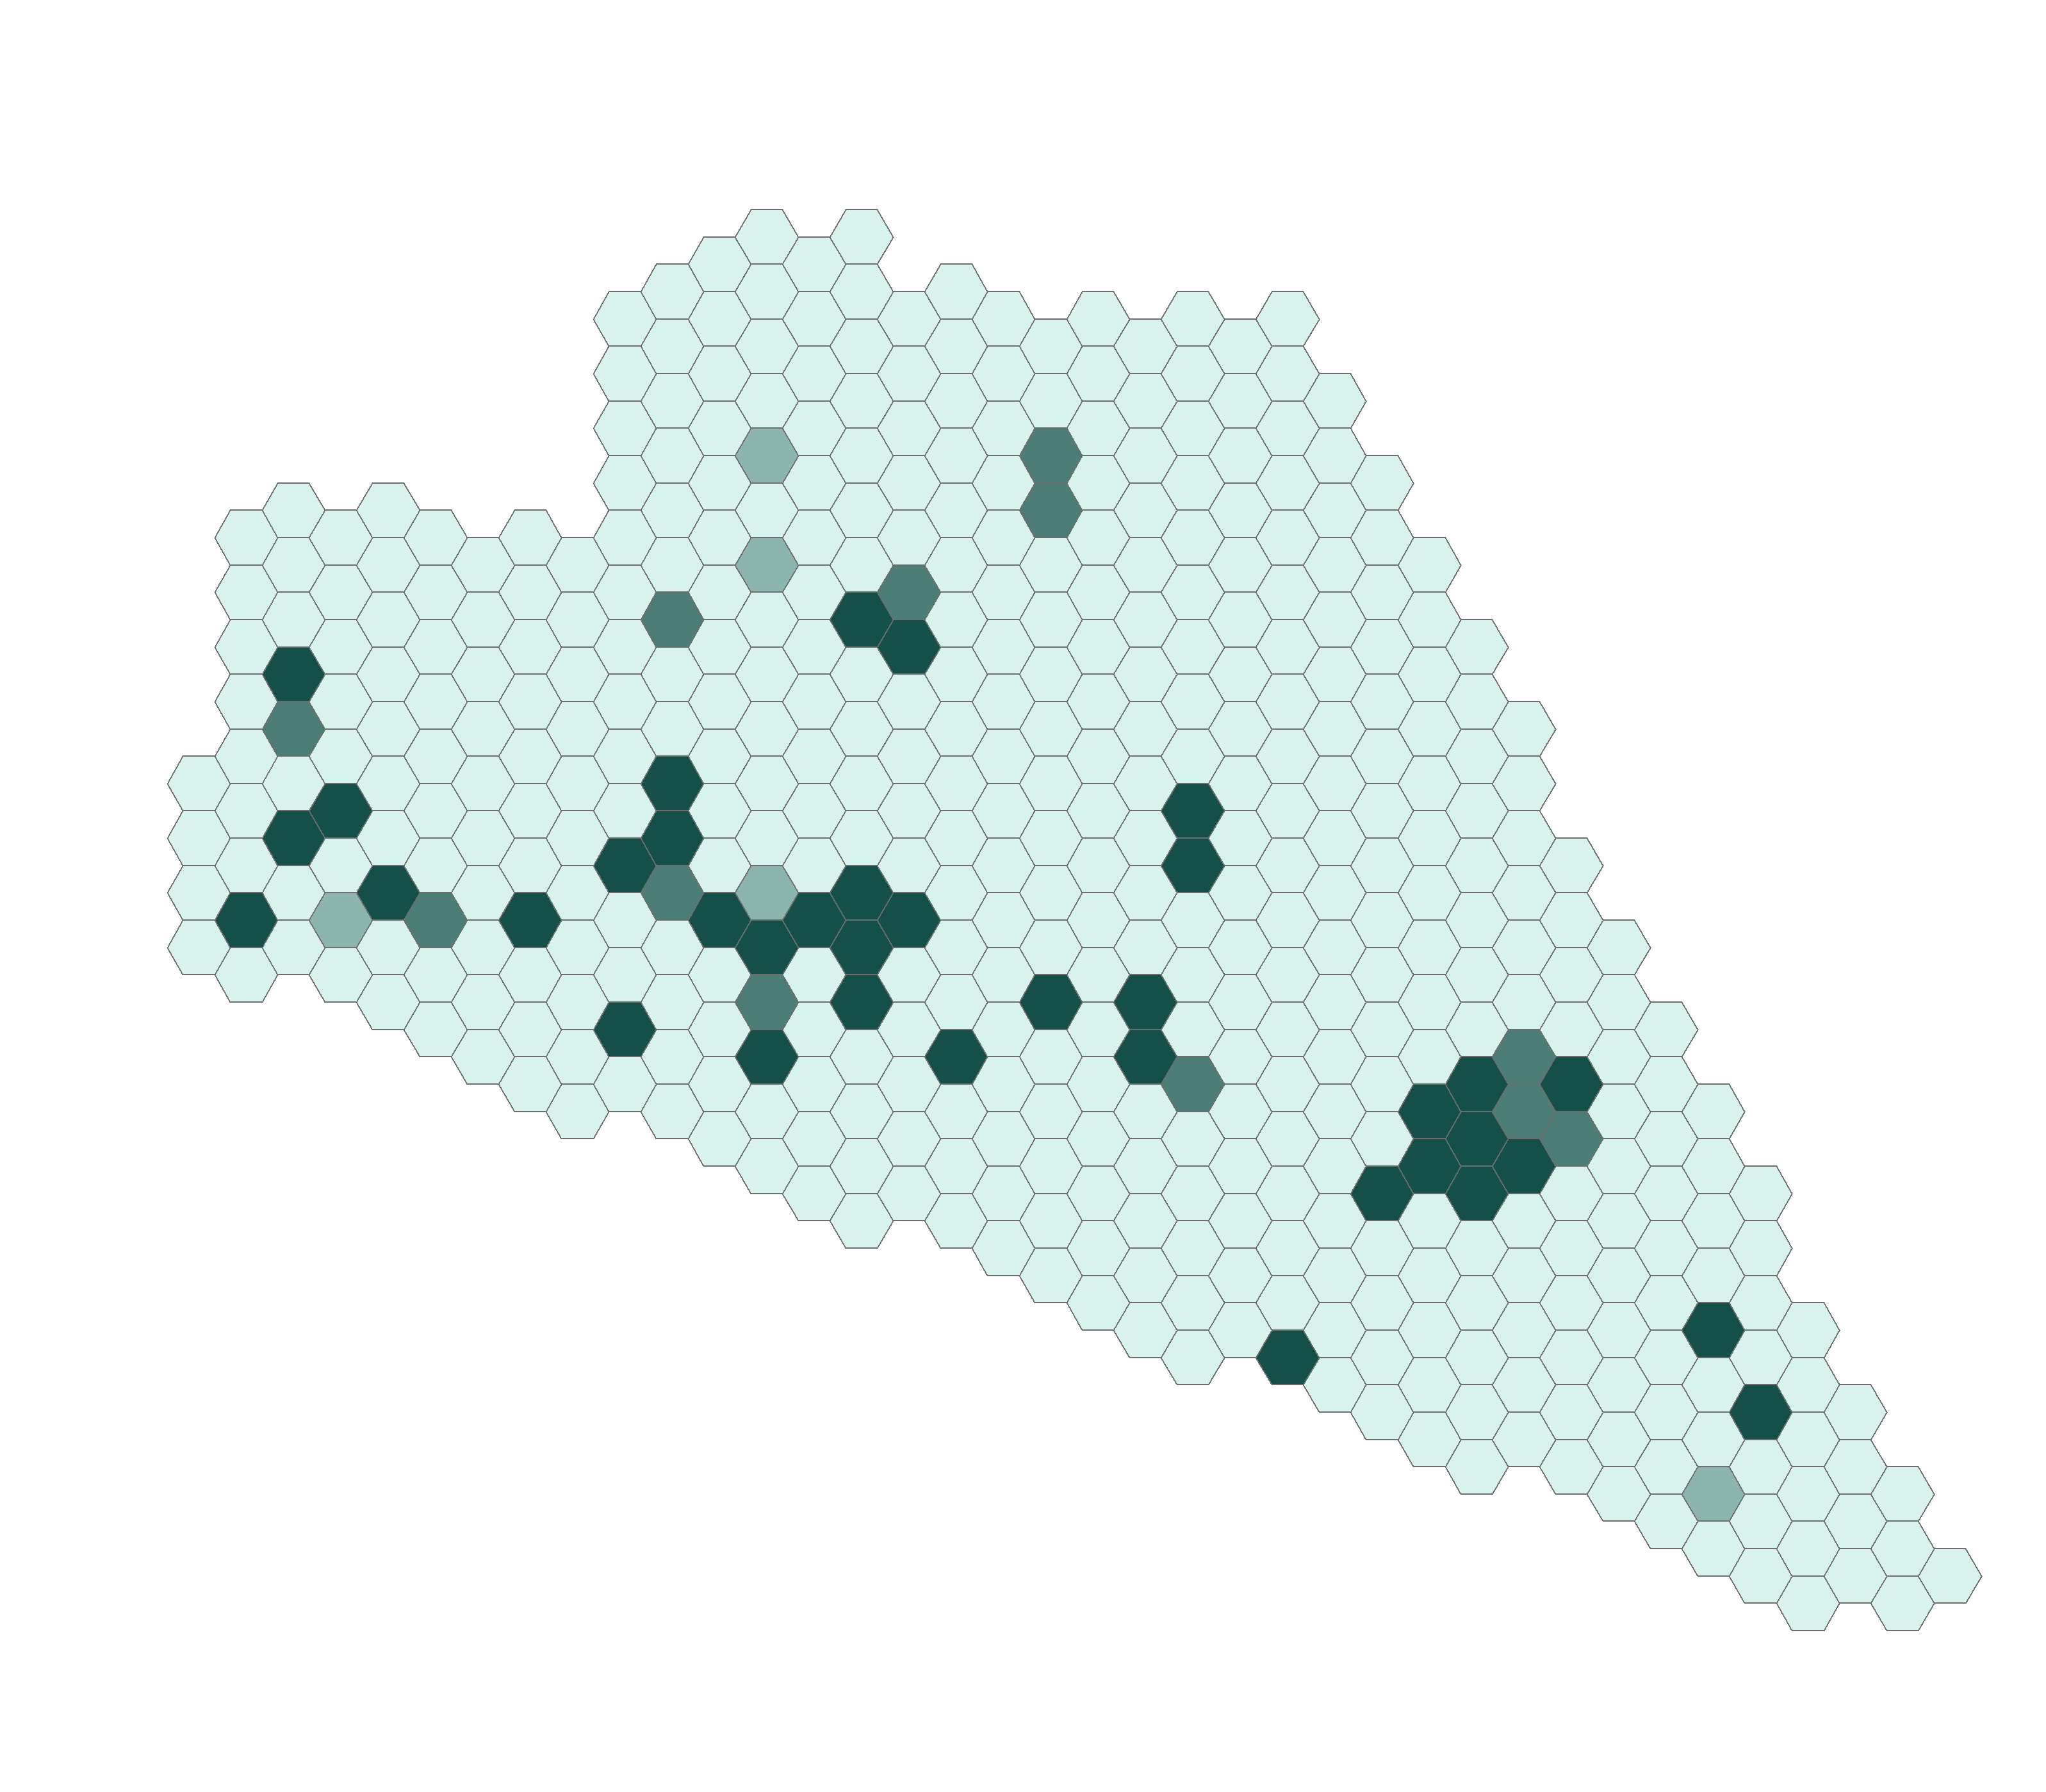
Figure 3: spatial distribution of restaurants with the value of star grades
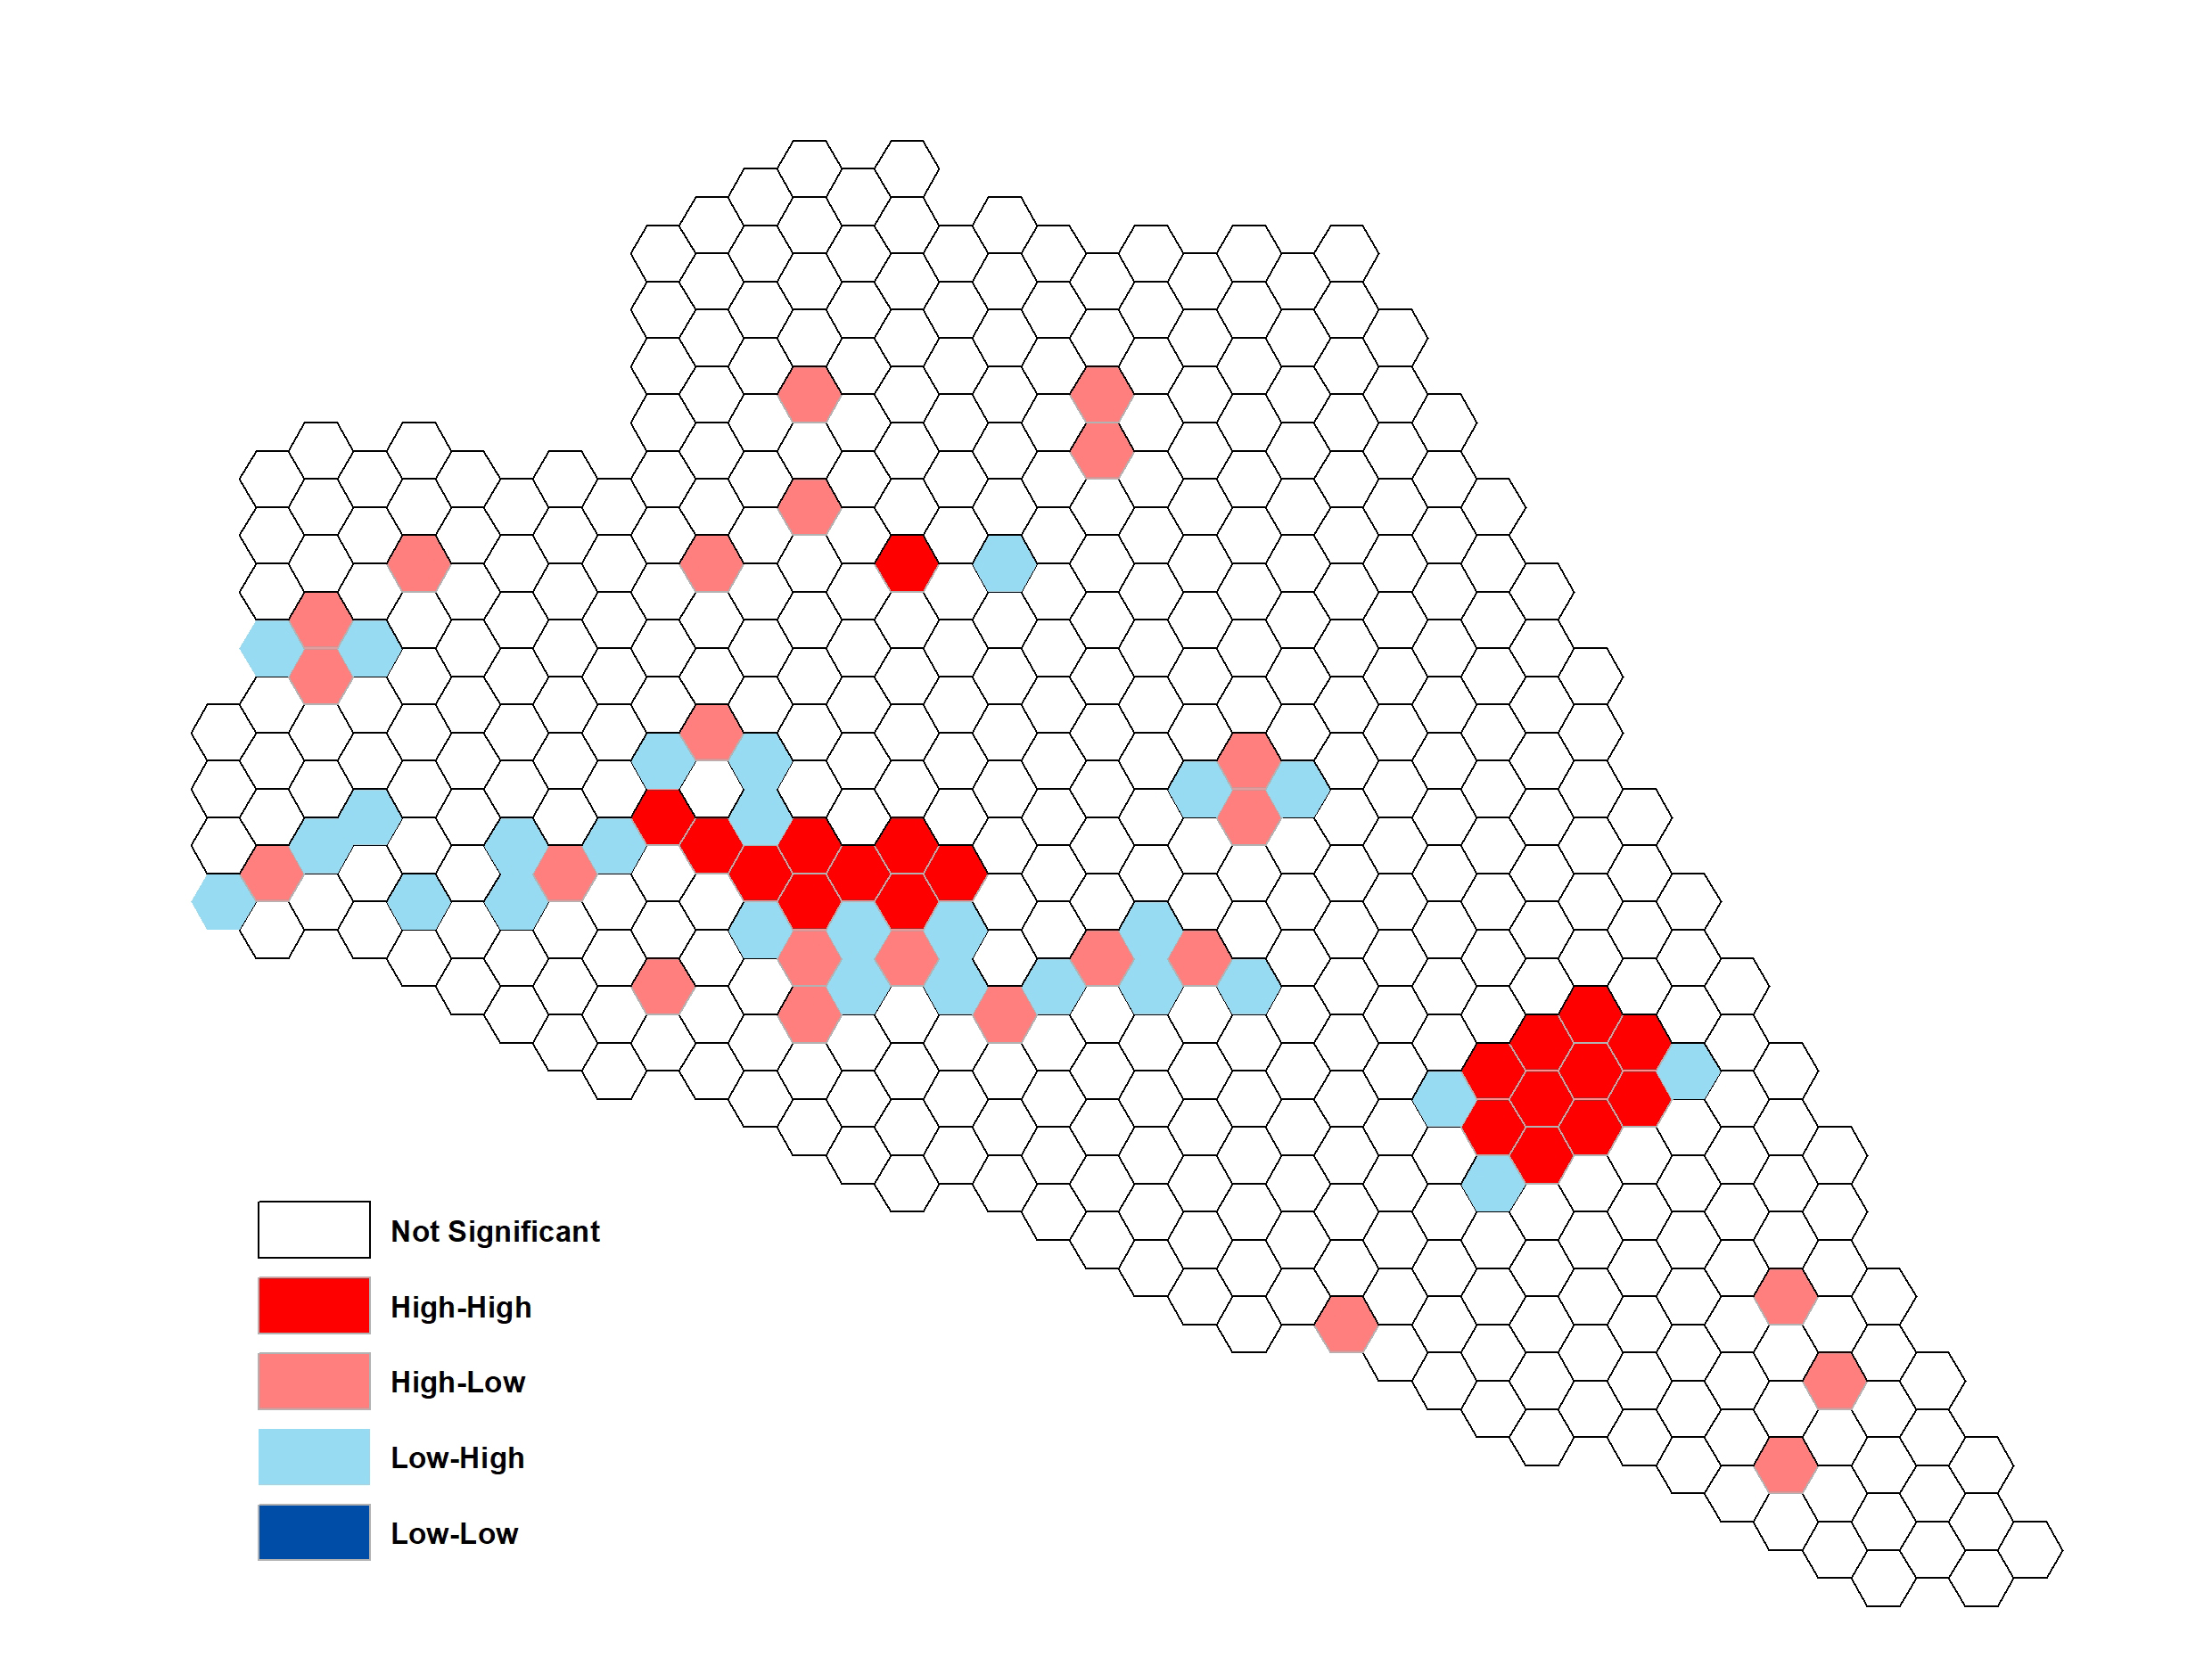
Figure 4: local Moran's I clustering in the area of MetroTech Center